Stock Trading Strategy: Lessons
A few months back I started sending out emails to friends and relatives about the basics of my techniques that I use for short to medium-term trading. The purpose was to share my knowledge and invite greater participation to test these techniques in real-time in US stocks. Though the total number of SIGNALs I use are more than ten, I sent out four lessons explaining four different signals. The result: each of those emails was a great success, very accurate, and great timing... I have put them here. If you are interested, try them.
Trading technique basics
Summary of first 4 lessons: Nov 3, 1999. (Quick view on stock charts)
Lesson 1. FullStop, Aug 11, 1999
Lesson 2. Gangotri. Aug 17, 1999
Lesson 3. Kick. Sept 21, 1999.
Lesson 4. Jump. Sept 22, 1999.
Click here to access some of the BEST FREE STOCK TRADING LESSONS
Trading Strategy basics: Let me explain to you all my 'indicators' which help me 'guesstimate' (guess+ estimate) very basic 'demand and supply' dynamics of the mysterious market and to capture changes as and when they happen. Tell me if you guys are interested because this is highly technical. It is also the most courageous and unique approach to analyze market trends. I understand that each of you may not be interested in it. If so, pls ignore this email.)
BASIC ASSUMPTIONS AND FRAMEWORK:
Every news, fed action, corporate result, analyst's recommendation or anything you may think of effects a stock' price (list of such influential factors would run into hundreds). As you would appreciate, the combined effect of all such factors is often so complex, 'mysterious', and offsetting that it often makes us believe that the markets are 'crazy'. However, each such development continuously boils down to 'shifts' of demand and supply curves which in turn pushes prices into a different 'range'. The shifting of the demand and supply curve is very dynamic and hard to interpret individually.
I ATTEMPT TO WATCH AND UNDERSTAND THIS VERY LOWER LEVEL OF MARKET BEHAVIOR and for this, all I use is daily prices- Open, High, Low, Close, and sometimes Volume. I understand that ONE can never be cent percent true about markets. So I target that I should be true 70%.(So pls don't bug me if I am wrong. However I would be really happy to discuss failures and learn from them.) Trade only when the potential for profit is three times more than likely losses. Be patient and wait for such an opportunity.The above three things give me three different prices:
Action price (at which to buy or sell),
stop-loss price (the price at which I would acknowledge that I made mistake and would stop my losses from accumulating further) and the
target price (at which I would book profit if I am true).Unlike most other analysts, I give a lot of importance to the daily OPEN price. Open price is the price at which a stock/market starts trading. Yesterday's prices, overnight developments, newspaper articles, nightly business reports, etc, and also institutional investors and all sorts of traders with their 'homework' start trading when the market opens. So the Open Price is a very good indicator to understand the aggregate effect of everything taken together that has happened since the close of yesterday's market and the opening of today's. I hope I am able to make my point clear to you.
GUIDING PRINCIPLES AND OBJECTIVES:
Don't be a bull or a bear.
Make MARKET TREND your friend instead of fighting with it head-on.
Safety of capital FIRST. Wait for opportunities and do the risk-reward analysis before you take a plunge and then
BELIEVE in yourself instead of believing in others.Everything that matters in this game is the MONEY WE MAKE and not the impressions we create on others about how smart WE ARE.
Follow your stop-loss limits and book profit at target levels unless you have stronger signals which suggest otherwise.
MY OPERATING FRAMEWORK:
CONDITIONS: very basic thing I work with is a CONDITION. As an example, a typical condition is: Today's open price is greater than yesterday's high price. I work with many such conditions each of which is some indicator or measurement of changes that take place in demand or supply or both.
SIGNALS: Each signal is a SET of some conditions maybe 5 or sometimes 10 which are TRUE altogether. Each signal is like a typical TEST to measure shifts in demand and/or supply curves. It can also be viewed as a SCENARIO.
ACTIONS: Each SIGNAL that takes place gives me the following things: Type of Signal: BUY or SELL or WAIT. Stoploss Price and sometimes target.
-
Summary of first 4 lessons: Nov. 3, 1999. Click here to see on charts how the lessons have performed .. Everybody. All four lessons are a great success. I hope you guys understand and appreciate the timing and reasoning this approach accomplishes.
-
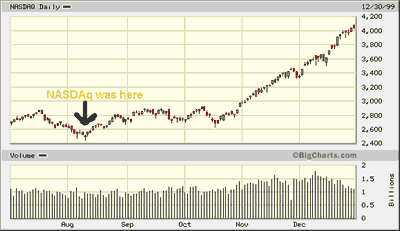
Lesson 1. (chart) Signal was bear Fullstop. We tested it on Wed 8/11/99 10:30 AM (during market hours) on the NASDAQ index when it was 2520 or so and we clearly flashed the beginning of the uptrend. (check the date and time and NASDAQ chart/prices). If you are tracking it, this was the first day of the current bull run which has taken it to 3000 plus today and we had tracked the signal online. So it was like, we got on the train during first 4 hours. Nothing was so accurate to point to the end of the downtrend and the beginning of the Uptrend. (see this on the chart of NASDAQ)
-
Lesson 2. The signal was Gangotri. We tested it during the market hours on NASDAQ but if you are able to recall it properly, the NASDAQ had closed higher when the markets closed on that day. So the last CONDITION in the SIGNAL had failed (...today's close price has to be lower than yesterday's open and close prices) and actually no signal was generated on that day. (However, if you had applied Gangotries to other situations, your payoff would be much higher on average).
-
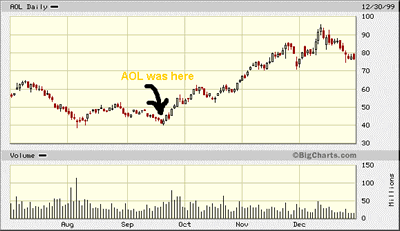
Lesson 3. (chart) SIGNAL was KICK. We tested it on AOL on Tue 9/21/99 4:41 PM (after market close). If you are able to recall, AOL closed at 85 or so on that day and that was THE FIRST DAY OF AOL's CURRENT BULL RUN which has taken it from 85 to 140 level today. (See this on the chart of AOL)
- Lesson
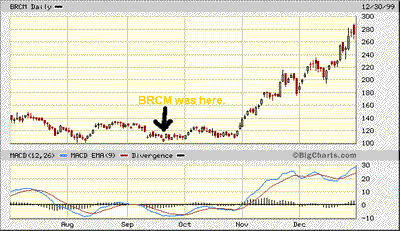
4. (chart) SIGNAL was JUMP. We
successfully tested it on BRCM on Wed 9/22/99 3:13 PM. Do you remember
that e-mail? (.".....a kind of rare combination to happen.....This
is a very powerful thing and a very strong signal). BRCM on that day
had closed at 113 and today it is at 150. MIND WELL, this was also the
FIRST DAY OF BRCM's CURRENT BULL RUN. These are the four lessons
so far. And each of them is a great success......(see this on the chart
of BRCM) ANY COMMENTS??
Lesson 1. Full-stop. Aug 11, 1999.
Let me write how I view today's market (NASDAQ) as an example. Today it is likely that we get a good signal which I call FULLSTOP. -
Conditions:
1. Yesterday's market should have LOWEST low price(2442) for the last few days. TRUE.
2. Today's close price (put the actual figure after-market closes today) should be higher than today's open (2532). TRUE (It was)
3. Today's low price has to be higher than yesterday's close (2490). TRUE.
4. Yesterday's close (2490) has to be lower than yesterday's open(2520?). TRUE.
5. IF today's low price turns out to be more than yesterday's high price, you can be 80% sure that the market's downtrend has ended for the time-being. -
ACTION: If all of the above conditions are true, then you can (i) take long positions at current prices (ii) with Stoploss put at yesterday's low price or rate.
Any questions? (I understand that my approach that is discussed above and which I intend to continue further in the next few emails is not quite an interesting matter for all investors. So if you find it REALLY interesting, pls e-mail me back. -
Some light discussion: STOCK market TIP is the worst kind of advice. If you give a tip to someone and if you are right about it, the receiver would say and would also actually BELIEVE that it was his idea ORIGINALLY; if you are wrong in your tip, the BLAMES for his losses would undoubtedly come back to you, maybe for years. So I do my best to avoid talking about stocks with most people unless I am specifically asked by someone. On the other side, I am really enthusiastic and helpful, if someone asks me. The whole purpose in 'bugging you' with this series(hopefully) of emails is sharing knowledge with friends and relatives. (Thanks to Kantilal Parekh, a veteran trader in India who passed away a few years back at around 90. (Stock traders usually don't live that long). His trading system has influenced me a lot which I have attempted to refine further based on my experience.)
Back to list of lessons | see what happened afterwards
Lesson 2. Gangotri. Aug 17, 1999.
This is the last E-MAIL related to STOCK MARKET that is sent to almost everybody who is on my list. Unless you have responded positively, you would not be sent such stock market related emails in the future. Sorry.
Do you remember the last e-mail? It was sent to everybody during the market hours when the NASDAQ was approx. 2510. Our target was 2610 to 2690. We are there. Today, something significant seems to be happening. NASDAQ is at 2660.
-
SIGNAL: This is another signal I use: It is called GANGOTRI. My favorite and the most powerful signal.
-
CONDITIONS:
1. Today's open (2675) has to be higher than yesterday's high (2661.15). TRUE
2. The market has to be in the uptrend. TRUE (look at last few days)
3. Today's high has to be HIGHEST (2677, would it go higher than this level? Wait until the market closes today) since the bottom was formed (2441). Could be TRUE but can be confirmed only aftermarket closes today.
4. Today's close (put here today's close price) has to be lower than yesterday's open (2647) as well as close (2647) (note: This condition failed as that day's close was higher than the previous day's open.)
5. If the volume is much better than yesterday, a signal is more powerful. (degree of confidence) I am in a little hurry and am not able to recall all of the conditions at present. - ACTION: if all conditions are TRUE, strong sell signal is generated.
STOPLOSS: today's high (2677+ 13 points)
TARGET: Market could go as low as 15% to 20%.(sounds impossible right? could go to 2200-2300 points) RISK of 40 NASDAQ points for a gain of what? 400 points...with 80 % confidence. Do the probability arithmetic and you would then love this theory more and more.. As I said, most of the work I do is related to gauge the market demand and supply shifts and may be more useful for traders than investors. (However, there is no fun in being a loyal trader or investor; JUST FOLLOW THE MONEY WHEREVER IT IS)Back to list of lessons | see what happened afterward
Lesson 3. Kick. Sept 21, 1999. One more feather in the crown of Gangotri. Do you remember the e-mail that I sent to you on 09/01/99 for LLY? Here is the target of 65. NEW LESSON: Lesson 3. (Silverline: If you are a bull by nature, something for you below. Love AOL).
- ACTION:
Can go long on the stock. TARGET: Targets are not as specific as they are
in Gangotri. However if tomorrow's close is higher than today's close,
a change in trend can be expected for quite some time.
STOP LOSS: Today's low - 1/2 percent ( 80 $ -0.50 cents) for traders. For investors, stop-loss can be overlooked because (1) AOL has come down from a high of 170 or so. So there is good value in this price for the near future. (2) most important reason for breaking a rule (only for investors- rule of stop-loss) is that AOL has been pretty strong in such a down day. Relatively very strong performance in a very weak day. What I would do? Watch tomorrow. As soon as it crosses 86 1/2, get on to it. Don't buy it below 79 in any case for the time being. Watch out for buying opportunities in AOL and keep it as a potential BUY candidate. Any confusions? Questions? Comments? Throw them to me. Love investment rides. Handle your heart with care. (Also use your own logic and strategy before you make any investment decisions.)
Thanking you,
Jayesh Patel, Ext 3785. Share your knowledge. It's a way to achieve immortality.Back to list of lessons | see what happened afterward
Lesson 4. Jump. Sept 22, 1999. Thank God, (Oh no, Thank AOL), you gave a good example for KICK by closing at 90+ today. (up by more than 5 dollars). Today it is a turn of BRCM to be used as an example for a new exercise. If you remember, a bearish outlook was taken on BRCM based on its chart around 128. Today it has closed at 113. If any one of you is really short on it, I would advise you to cover the short position (I would resist the temptation to initiate a long position in it for certain reasons). Ideally, BRCM could have been bought today at around 109 as soon as it opened for trading.
-
ACTION: Cover your short and can initiate a bullish position. (Short-term traders/day traders can be more proactive to take a bullish position as soon as BRCM opens higher(108) than yesterday's high (107.5) instead of waiting for the prices to close.) STOP LOSS: Yesterday's low price - 1% (103.12 - 1 = 102 dollar) TARGET: No specific targets are there for this signal. VALIDATION: Close above today's close (113) in the next three days is a good confirmation of trend reversal. This is it for JUMP. (Yesterday, there was a BEAR GAP in BRCM and today there is a BULL GAP. This is a kind of rare combination to happen. Today 108.75, 115.12, 108, 113.25. Yesterday 107.5, 107.5, 103.12, 104.12. The day before yesterday, 112.68, 113.75, 108.75, 109.31. This is a very powerful thing and a very strong signal. This has made me drop my Bearish outlook on BRCM and book profit.) Comments
- (SERIOUS
STUFF): BRCM is a good example to reiterate to you all why I love this
approach of analysis. As you would agree, stock markets are very dynamic
and we are here to make money. For this, we need to change our opinions
and positions as quickly as possible, as and when things change. AND
to understand such changes, it does not take lots of IQ or lots of degrees
or TV shows or magazines..; all that is required is just an objective
approach to DAILY PRICES and an attempt to clear ourselves from emotions.
Why we lose money in markets? 'cause we take an approach ...like an
ostrich in a desert. We close our eyes to certain warnings, 'paint'
the reality in our favor, talk to only those friends who could justify
(and not criticize) our decisions.
For me, trends are like a crazy river and there is no fun in swimming against the flow. I have followed many theories and strategies so far, but nothing is as effective and as fast as this theory in confirming the changes in trend, acknowledging mistakes(stop-losses), and giving you target prices.
Half of
the bull Gangotri is often referred to as KICK. (notes: 1.Kick can become
a 2-day Gangotri.
2. Bearish counterpart of Kick is Dive.)
Warning: It is not as powerful as Gangotri. Chances of failure
are more. (Then why do we still like it? 'Cause it still falls into
3:1 ratio of Reward to risk.)
.
Let us take AOL as an example here today.
CONDITIONS:
1. Today's open (81 7/8)has to be lower than yesterday's low (82). (similar to Gangotri)
2. Today's close (84 7/8) has to be higher than yesterday's close (82.8275). (if today's close is also higher than yesterday's open (86.0625),
then this would be a bull Gangotri. However, If tomorrow, AOL closes
above 86.0625, this would be a 2-day Gangotri. Though not as powerful
as a normal Gangotri; it is still a pretty good signal)
3. Today's low (around 80?) has to be the lowest in the last few days/weeks.
4. Today's volume has to be higher than a normal volume.
SIGNAL DESCRIPTION: A very good signal for a trend reversal from bearish to bullish. (Its bearish counterpart is FALL.) It is more reliable and powerful than FULL STOP and is a just little different. It also contains a signal BULL GAP in it with only little but very powerful modification.
CONDITIONS:
1. Today's low (108) has to be higher than yesterday's high price (107.5).(it
is a gap)TRUE
2. Yesterday's low (103.12) has to lowest for the last few days/weeks. TRUE
3. Today's close (113) has to be higher than today's open (108.75). TRUE
4. Volume has to be more today (3.4 million Vs 2.8 million yesterday)
for increased confidence. TRUE
5. Yesterday's low has to be less than the recent bottom. I mean a new
lower bottom formation should be in making. (Unless you are serious
enough to master this technique, you can omit this condition) TRUE
Back
to list of lessons | see what happened
afterward
(Use your own judgment and strategies in making your investment decisions.)